Datarts - your platform for beloved (& yet unusable) graphs
Hi everyone and welcome to datarts!
I'm glad you found your way to our website. Here, we want to provide a platform for the interface between science and arts, namely datarts: scientific graphs that have the potential to take our breath away because of their beauty, independent of their scientific value. We admire graphs that were created by accident (oops, wrong variable), by banging the head against the wall (i.e., wrong code), by trying something out, by a null result or by a non-null result. We really don't care (except that it has to be real data!).
With this we want to give those graphs a chance that we stumble across during our everyday life - which look stunning - but which don't actually make sense or won't get published at the end of the day. Just look at these wonderful examples!
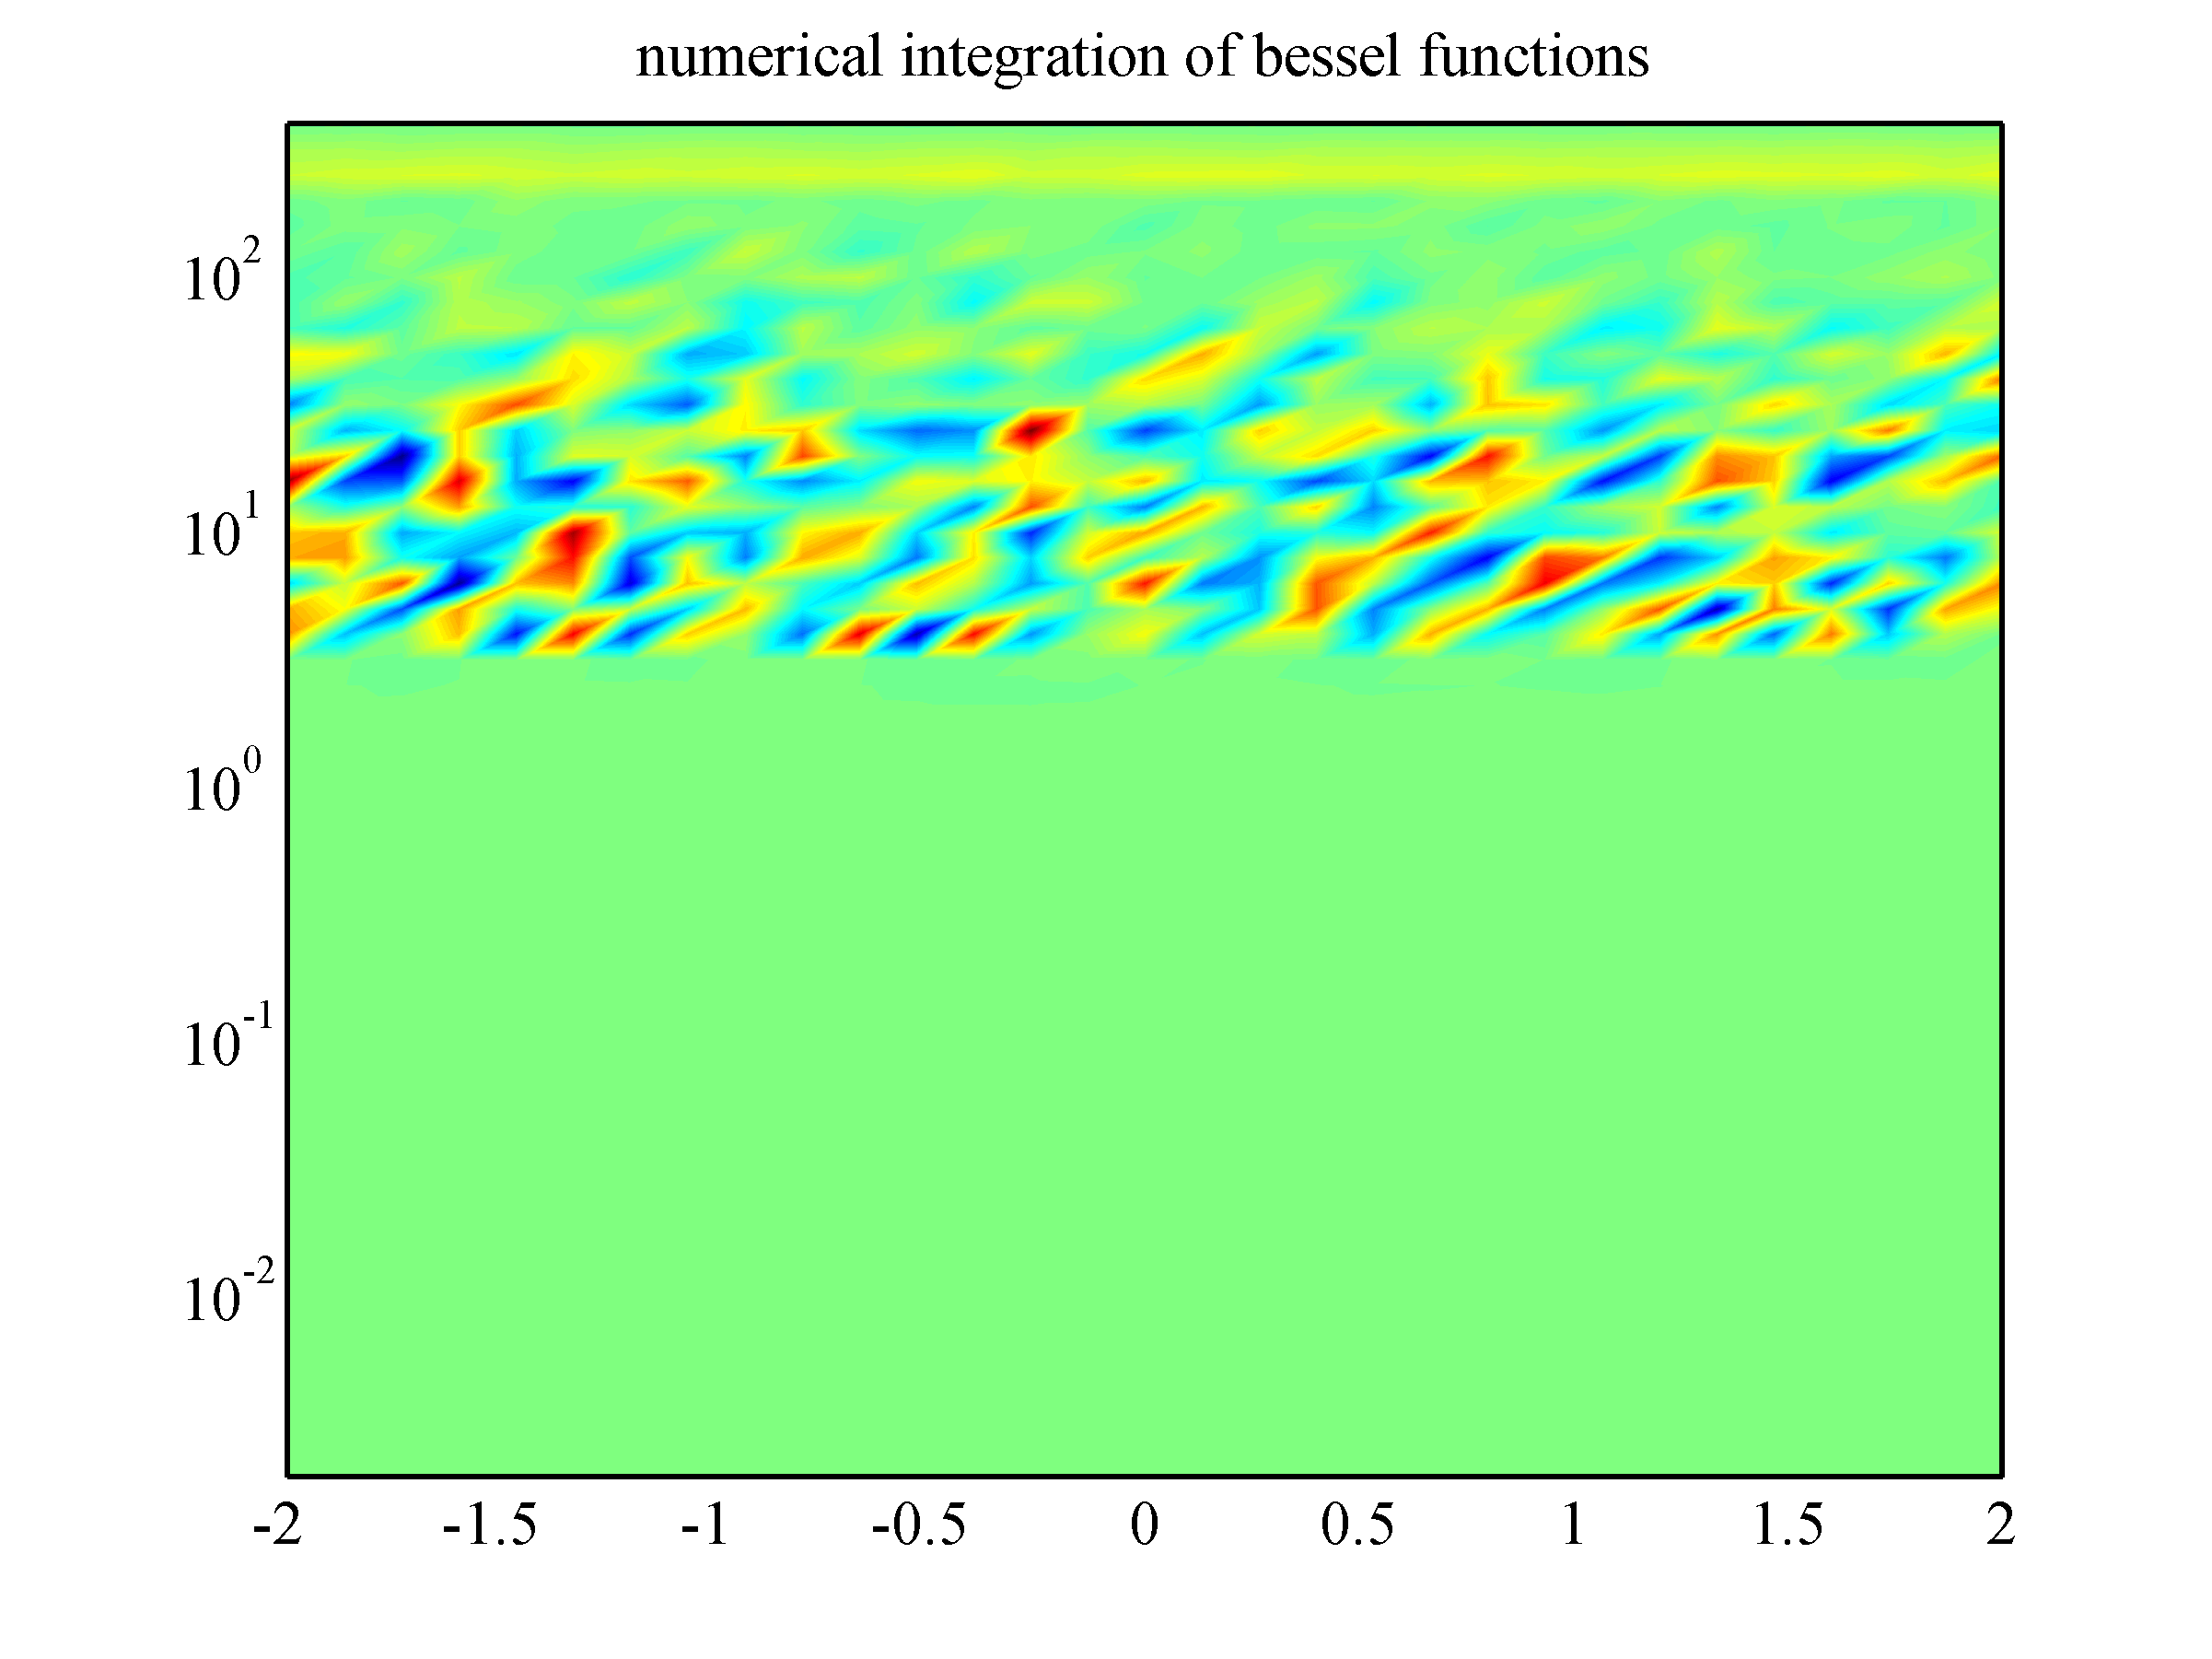
Sebastian (Biophysics)
To quote MATLAB: “The integral may not exist, or it may be difficult to
approximate numerically to the requested accuracy.”
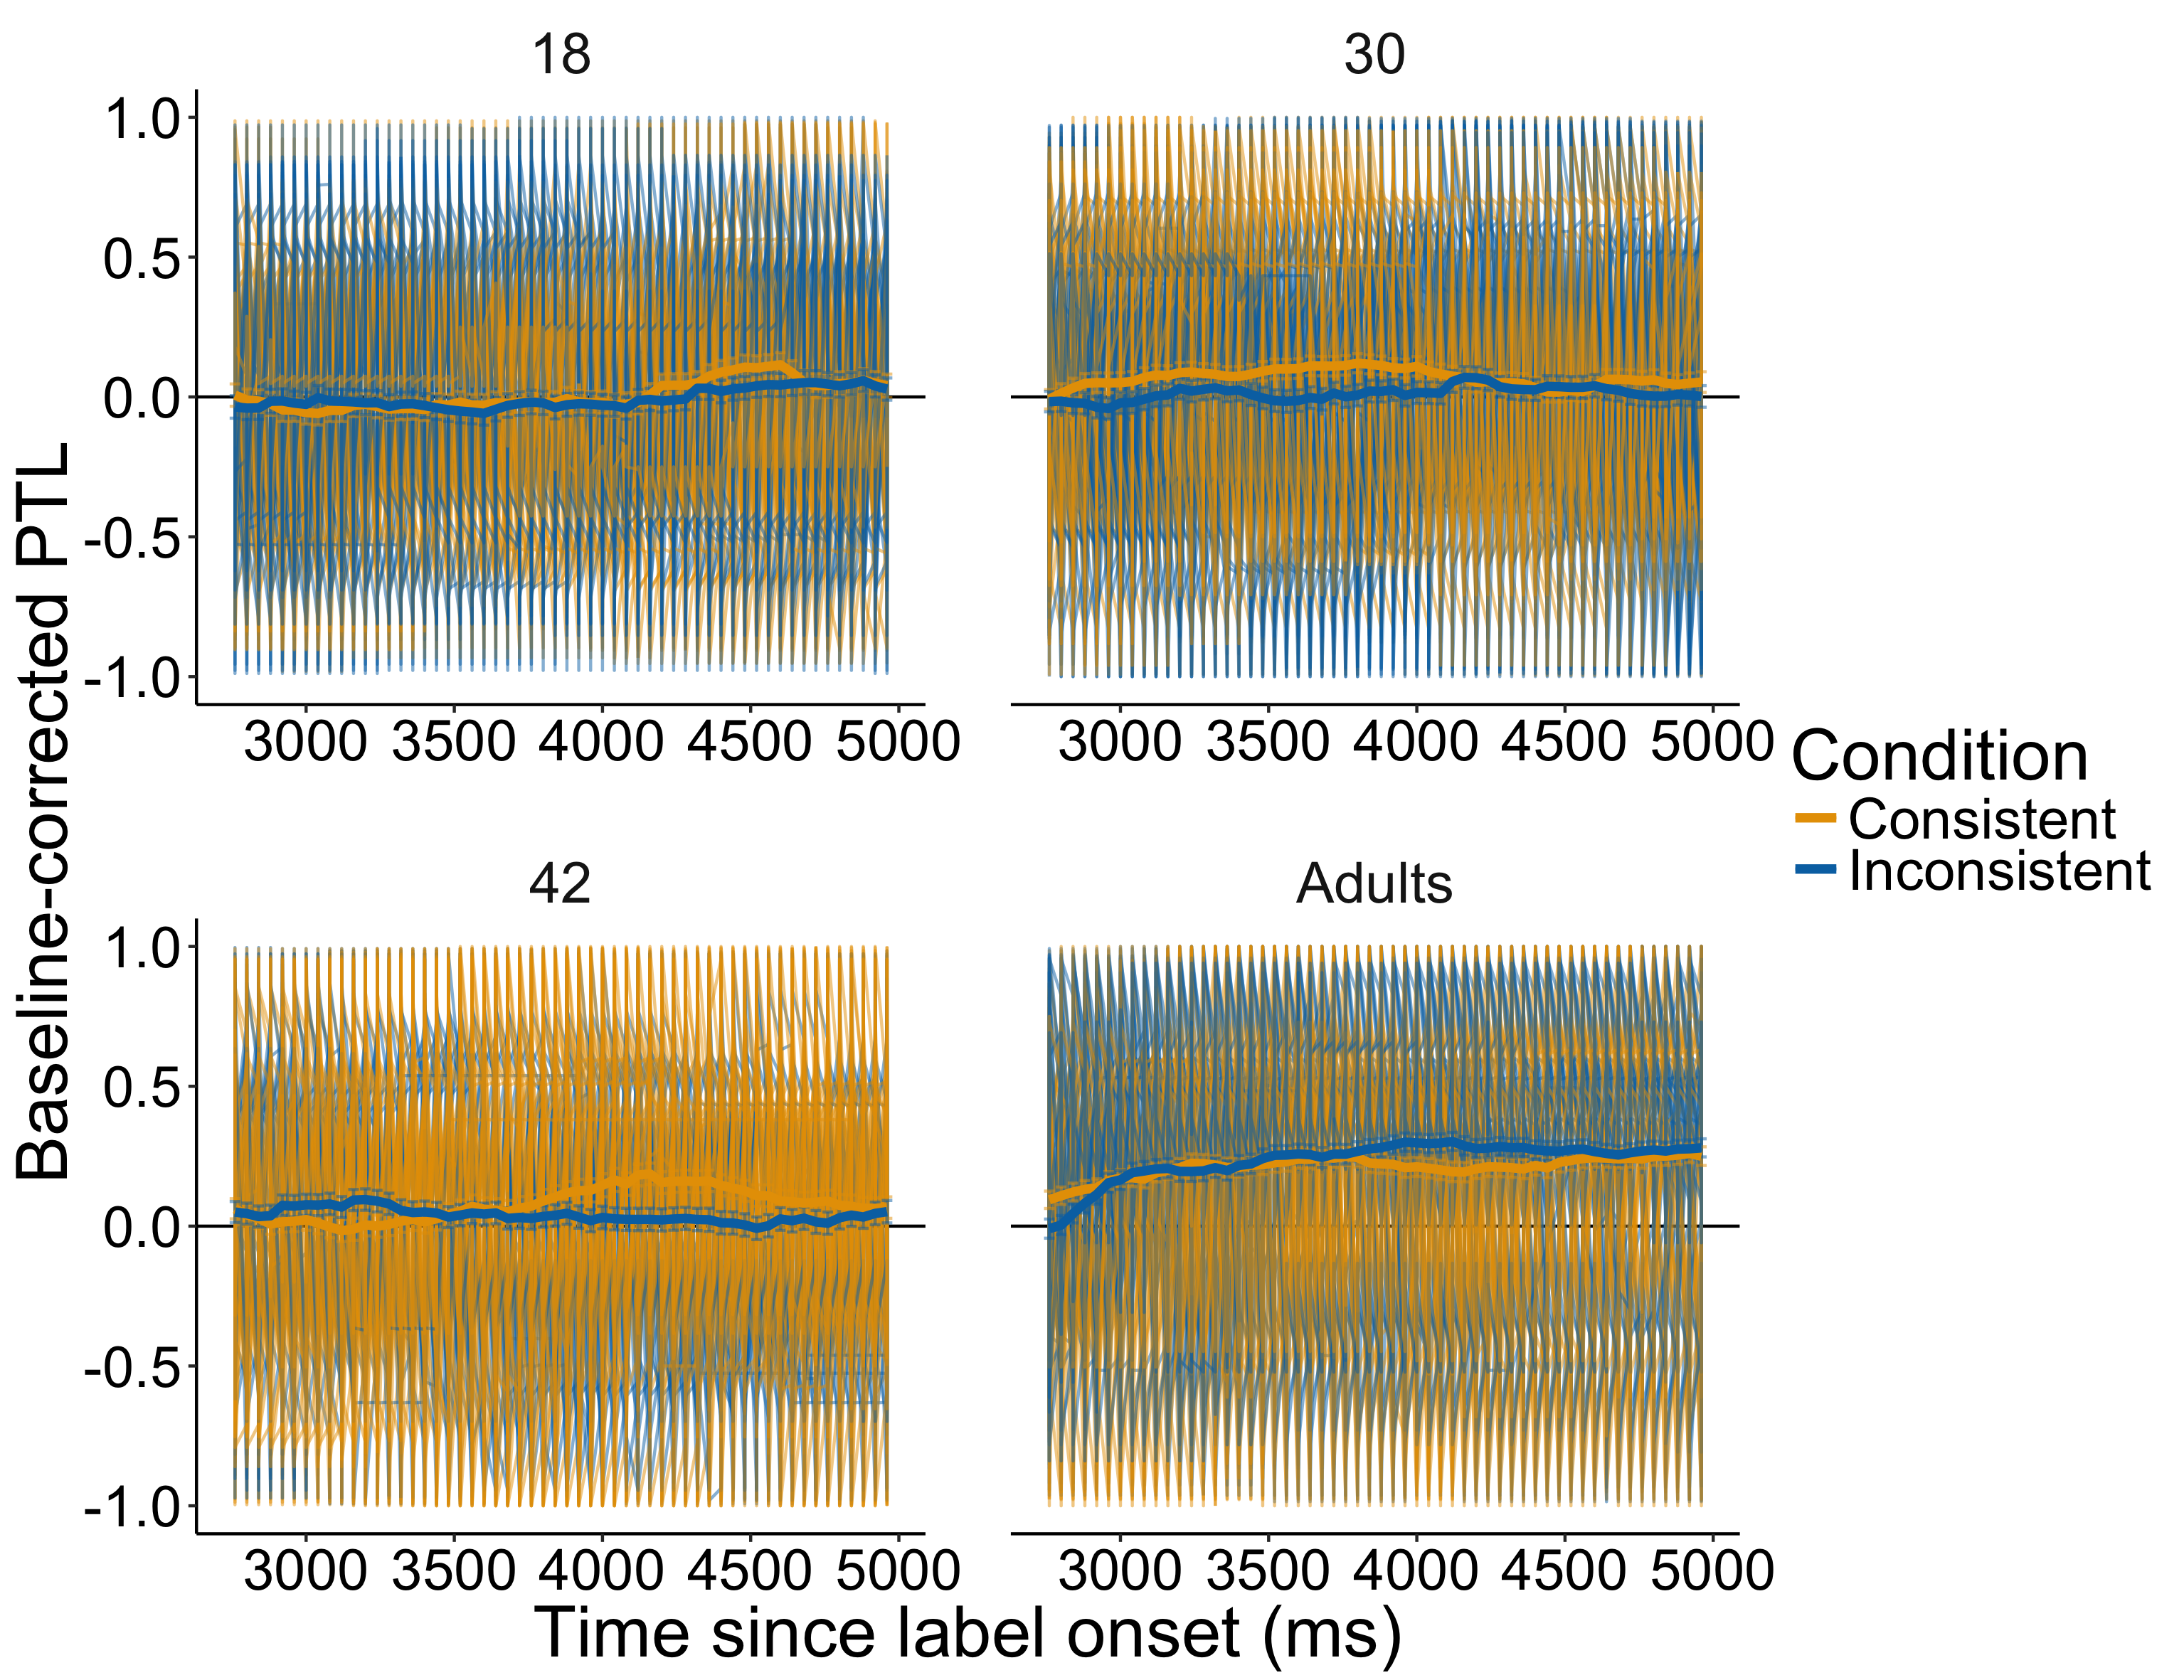
Sarah (Language Acquisition)
The graph is supposed to show how children look to the right picture when I label
the object depending on whether the object always moved in the same way (consistent) or different
ways (inconsistent) in a previous training phase.
Just wanted to have the data of each child in light grey in the background.
If you want to participate and share your graphs with us, please don't hesitate to send them to datarts@sarah-eiteljoerge.de with the following information:
- Your name
- What you do (if you would like us to mention it)
- The graph (seriously, don't forget to attach the graph) with a minimalistic caption explaining what the graph shows (in normal English please!)
- How the graph was created (wrong variable? weird code? null result? non-null result? Something else?)
All content copyright 2018 datarts!